
AutoFigure: Generate Editable Scientific Illustrations
Auto Figure transforms method text from research papers into fully editable SVG illustrations — publication-ready scientific figures you can freely modify.
Combining LLM-based generation with SAM3 segmentation and vectorization, Auto Figure produces high-quality methodology diagrams, supports style transfer from reference images, and includes a built-in SVG editor for in-browser refinement. Whether you call it AutoFigure or Auto Figure, the result is the same: beautiful, editable academic illustrations in seconds.
Try AutoFigure Now
Experience Auto Figure's automated figure generation firsthand. Paste your method text, optionally upload a reference image for style transfer, and let AutoFigure create a publication-ready editable SVG illustration. Auto Figure supports methodology diagrams, system architectures, flow charts, and more — all generated from natural language input and output as fully editable vector graphics.
tip: concise, structured method text yields cleaner templates
tip: upload a figure from a paper you like to transfer its visual style
No Images Generated
AutoFigure Gallery
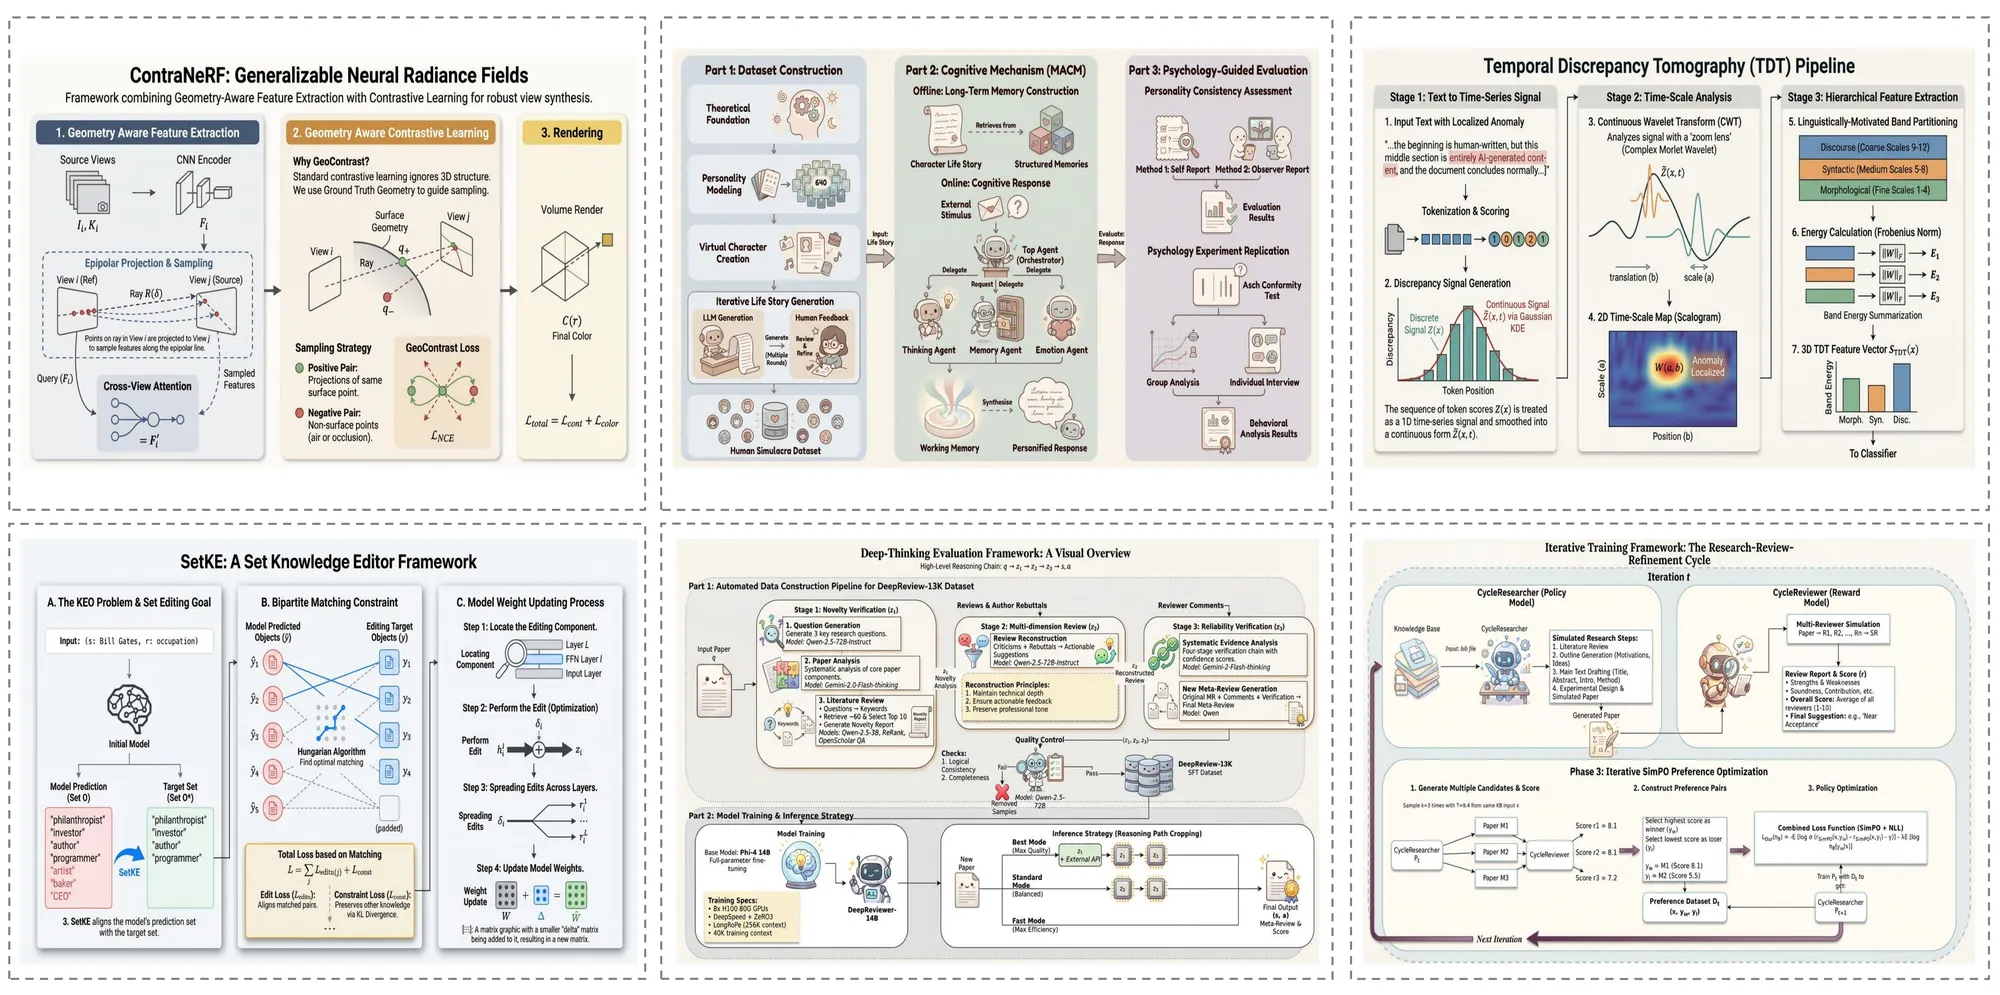
Explore what Auto Figure can create — from methodology diagrams to system architectures and beyond. Every example below was generated by AutoFigure's four-stage pipeline directly from paper text, producing fully editable SVG output.
Paper Case
Auto Figure generates publication-ready methodology diagrams directly from research paper text. Complex model architectures, multi-stage pipelines, and encoder-decoder frameworks are rendered as fully editable SVG illustrations with precise shapes, connectors, and labels — ready for top-venue submission.
Survey Case
For survey papers, AutoFigure creates comprehensive overview diagrams that capture the taxonomy, relationships, and comparisons across multiple methods. The generated figures help readers quickly grasp the landscape of a research field with clear visual hierarchy and consistent styling.
Blog Case
AutoFigure handles informal technical writing too. From blog posts explaining machine learning concepts to technical tutorials, it generates clear and visually appealing diagrams that make complex ideas accessible to a broader audience.
Textbook Case
For educational content, AutoFigure produces textbook-quality illustrations that clearly convey foundational concepts. Whether it's a neural network architecture, a data flow diagram, or a biological process, the generated figures are suitable for lecture slides, course materials, and textbook chapters.
Frequently Asked Questions
Common questions about AutoFigure and how it works.
Start Creating with AutoFigure
Transform your paper text into editable SVG scientific illustrations with Auto Figure. Try AutoFigure's AI-powered figure generator above, or read the ICLR 2026 paper to learn more about Auto Figure technology.
Key Innovations of Auto Figure
AutoFigure-Edit introduces several breakthrough innovations for automated scientific illustration generation, published at ICLR 2026.
System Architecture: The 5-Stage Pipeline
Auto Figure transforms scientific text into editable SVG illustrations through a 5-stage pipeline. Each stage builds on the previous one, progressively transforming raw text into a fully editable, publication-ready vector illustration.
Stage 1: Raster Generation
A vision-language model (Gemini 3.1 Flash) reads your method text and optional reference image, then generates an initial raster draft (figure.png). The LLM understands scientific figure conventions and translates textual methodology into a visual composition.
Stage 2: SAM3 Segmentation
Segment Anything Model 3 (SAM3) detects and segments distinct components — icons, text regions, connectors, shapes — using structured prompts like 'icon, person, robot, animal'. Outputs bounding boxes with confidence scores and a segmentation map (samed.png).
Stage 3: SVG Templating
Using the original figure, segmentation mask, and box metadata as multimodal inputs, the LLM (Gemini 3.1 Pro) generates a placeholder-style SVG whose boxes align with labeled regions. RMBG-2.0 removes backgrounds from cropped icons to create transparent assets.
Stage 4: Final Assembly
The system aligns coordinate systems between the SVG template and original figure, then replaces placeholders with transparent icons extracted from segmentation. This produces the assembled SVG (final.svg) with all components as individually editable vector elements.
Stage 5: Iterative Refinement
An optional optimization stage performs iterative SVG refinement — path optimization, stroke recognition, and layout fine-tuning. Users can also refine the output in Auto Figure's built-in svg-edit canvas with drag-and-drop composition, completing the text-to-editable-SVG workflow.
Share AutoFigure